In motor testing, the Rotor Influence Check, or RIC as we have come to colloquially call it, is one of the means applied in motor acceptance as well as route-based inspections, and often is used as a troubleshooting method for particular failure modes discovered during route based inspections. It’s performed on induction motors as well as synchronous motors and is intended to give us an idea of the condition of the rotor and the air gap between the rotor and stator.
RIC is performed by rotating the rotor in increments around a 360-degree rotation. The length of the increments is generally driven by the number of poles in the motor. Inductance measurements are taken at each increment and a plot is generated showing those results. The test signal that is injected into the motor is low power, and as such is insufficient to generate a detectable level of magnetic signature on either the rotor or stator. What is actually being measured is the residual magnetic alignment that is present in the motor after having been run. Even new motors are run tested before shipment, so often there is still enough residual magnetic energy to produce a pattern on a motor that was just received. This residual magnetism is what influences the test signal and develops the resultant plot. See the image below for an example of a normal RIC plot.
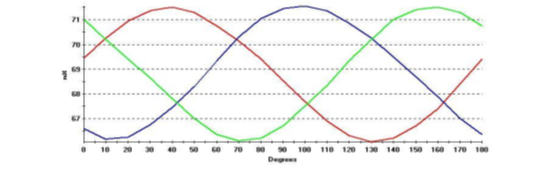
This is the pattern most motor testing analysts expect to see when they perform a RIC test. This is what is referred to as a rotor with influence. This is a common pattern for this cast aluminum rotor motors. Because there are so many of these in service in various sizes, this is a pattern often seen. However, every once in a while, you might run a RIC and see a pattern like the one below.
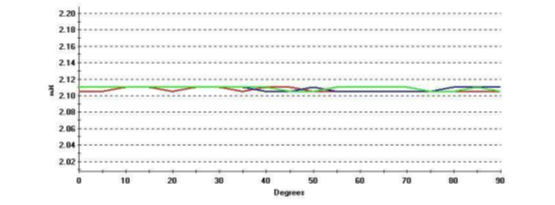
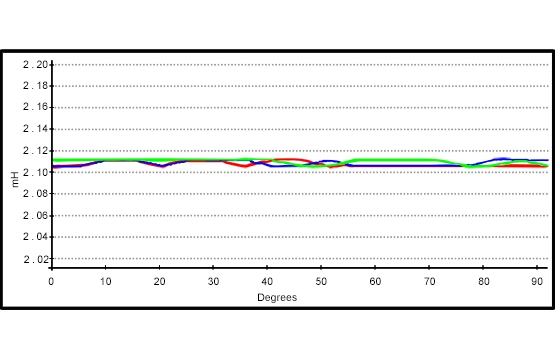
This is a pattern for a low influence rotor. The reason for this kind of plot can be varied as well. Motors with a large air gap between the rotor and stator will typically have this kind of plot, in which case this type of plot is perfectly normal. Also, motors with copper rotor bars, or very high-quality motors will have low influence, again in this case this plot can be considered normal. With this kind of pattern, what becomes important is checking for increases in the amplitude of the inductance waveforms. As rotor bar defects develop, the inductance will rise and the sinusoidal shape in the inductance waveforms will become more and more pronounced.
If you’ve never encountered this type of RIC plot before, it can be confusing. With the types of motors described above, this is perfectly normal, so don’t jump to the conclusion that you’ve performed the test incorrectly. Investigate and determine if the motor under test is in fact one of the types above and monitor it closely as it remains in service. The changes in the plot for this type of motor are more discrete than in other types, so be careful to watch for them.