


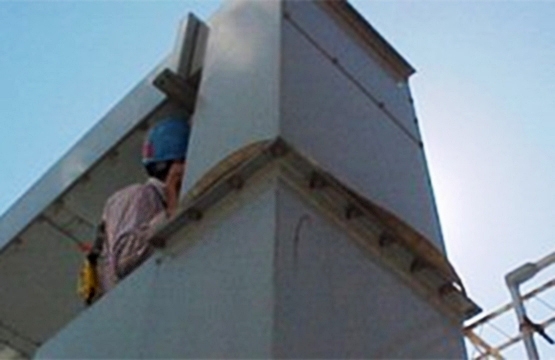
The visual image above is a duct of a transformer showing no visual indication of heat-related failure.
Using thermal imaging to determine both the source, cause, and severity of a hot spot isn’t always easy. Just because you see a thermal anomaly doesn’t necessarily mean you have located the source of the abnormal heating. In almost all cases, thermographers are only detecting heating that has by some method of heat transfer, conduction, convection, or radiation, migrated to an area where they have a direct line of sight.
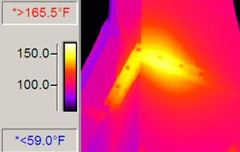
The thermal image of the duct shows an apparent 40-50°F (22-28°C) temperature rise on the surface.
The thermal image of the duct shows an apparent 40-50°F (22-28°C) temperature rise on the surface.
In the case of high resistance connections, even on small electrical circuits, thermographers should understand they are only observing the surface of the outside of the connector or conductor and that any heat being generated is coming from inside at the point of contact. The temperature difference between the source (i.e., the actual fault) and these surfaces have a thermal gradient. In most instances, heating at the fault is far more severe than what is appearing at the surface suggesting the potential presence of a large thermal gradient.
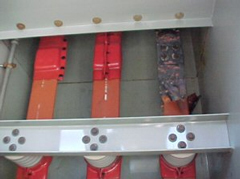
The photo above pictures an inside view of the duct showing a copper bus bar in advanced stages of failure. The level of damage suggests a much higher internal temperature than what was observed on the surface of the bus enclosure as there was a very large thermal gradient present.
When inspecting components with large thermal gradients, such as enclosed electrical buses or any oil-filled device (including circuit breakers or transformers), carefully look for very subtle differences in temperature by narrowing your span, to increase the thermal contrast and appropriately adjusting the level of your image. Any anomalies detected using this method on this type of equipment may be an indication of a potentially critical internal problem.
The Snell Group covers large thermal gradients in the Level 1, Level 2, and Infrared for Electrical Inspections< courses. If you are involved in the world of electrical reliability, consider joining EPRA (Electric Power Reliability Alliance) for shared resources, tools, and experiences in reliable electric power systems.