Training Schedule
Training for Infrared and EMT professionals world-wide.

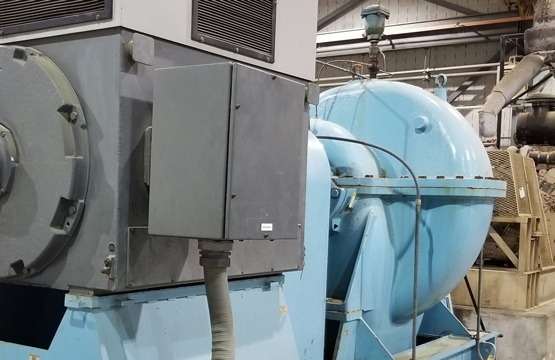
Monitoring energized electric motors is becoming a common practice as part of reliability programs. Power quality and motor performance can be assessed in a matter of a few seconds of data acquisition. The most important parameter for assessing power quality and motor operation is by far analysis of voltage. If voltage is problematic all other data will reflect that.
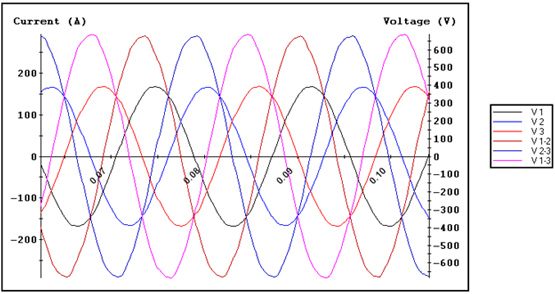
Figure 1. Peak and RMS Voltage Time Domains
When analyzing voltage, we look for phase balance and a value that correlates with facility power requirements. What we measure with a multimeter, say on a 480 system, is the RMS value of that line voltage or .707 x the peak. We display 480 volts but in actuality, the voltage is 678 peak volts. The peak voltage is 1.414 x the RMS value.
The definition of RMS Voltage:
RMS voltage is the DC equivalent of an AC waveform so that we can compare power dissipation with both the AC power and DC power waveforms. If we have an RMS waveform of an AC signal and it is the same value as a DC waveform, then we know that both waveforms give off, or dissipates, the same amount of power in a circuit.
We can simplify that and say RMS is an equivalent to DC voltage. Crest factor is considered as the same as the Peak Voltage. However, our modern PQ and motor test equipment analyzes for the peak value to include any stray frequency influence on the fundamental wave form. This could cause indications of crest factor over the 1.414 value and could also be indicative of a problem in the facility that is affecting power. When present, these anomalies should be investigated and isolated to the source and a determination made as to system impact.
For more information on Power Quality and electric motor testing. Contact the Snell Group and schedule one of our comprehensive training courses. Don’t forget to ask about our new De-Energized Electric Motor Data Analysis Wall Chart. A 36” x 48” laminated chart that is a wealth of information.


