
At a first, inspecting buildings with thermography might appear to be a rather straightforward endeavor. While this is partially true, there are some points to be considered. Heat transfer in buildings can be dynamic and understanding the thermal conditions and how they change during the inspection process is essential to interpreting the data collected. Additionally, it is important to understand that the thermal patterns present in a building may not always present themselves as might be expected.
The general premise of IR inspections of buildings is that abnormal heat loss or heat gain can be detected, and a determination of the root cause is made based on the detected thermal pattern. Detecting abnormal heat loss or gain often is the simpler part of the overall equation, particularly with advances in imager technology. Connecting the dots to arrive at the root cause is where mistakes can be made. Assumptions cannot be relied upon to provide the answers we seek, so the next step in the interpretation of images is further investigation of the building system where abnormal thermal patterns have been detected.
The keys to interpreting a thermal signature in a building can be summed up as follows:
- Anomaly size, intensity, and location
- Building construction
- Inspection conditions
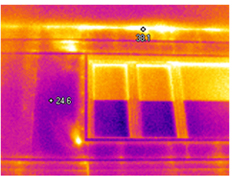
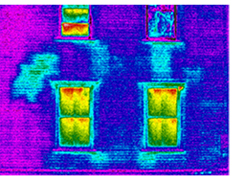
In cases where the shape is regular, for example in a rectangle, the anomaly might be associated with framing and could be missing or defective insulation. An irregular pattern that crosses the apparent boundaries of framing, however, might not be missing insulation, so more investigation is warranted. Locations that are between floors, under windows, or other fixtures are often spots that are hard to insulate and could be voids as well.
Intensity can also be a good indicator of the root cause. An area of a large thermal difference could indicate trapped moisture since wet insulation is thermally conductive compared to other building materials, but it also had a higher thermal capacitance. Lower intensity patterns can be the result of conduction losses due to other factors, such as air movement in and through the insulation, or internal heat sources in direct contact with wall systems. HVAC ducts routed behind insulation, appliances that generate heat energy directly contacting or are in close proximity to the exterior wall, and spots where there is a greater occurrence of thermal bridging can all cause irregular patterns of differing thermal intensity.
The downside here is that the same keys that can be helpful can also be misleading. So again, assumption is the enemy of due diligence, and it is imperative that a deeper investigation of detected anomalies be undertaken to ensure proper image interpretation.