In Part One of our exploration of Measurement Parameters we discussed Emissivity, Background and Transmission. Those measurement parameters will all change our apparent temperature measurement in our thermal images, whether we change them on the camera or in the software. There are other tools at our disposal that do not change our temperature measurements, but instead provide different methods to report temperatures or visually illustrate anomalies in our images. It varies by model, but some of these measurement tools are available in the camera, while some are not. Almost all of these tools are available in the PC software for the imager. Some of the common measurement tools found in cameras and camera software are:
Spot Meter: This measurement tool is one which with many people are familiar. It is generally a crosshair or reticle type shape that can be placed on areas of interest within the thermal image. Usually a spot meter is relatively small, so a number of them could be placed in a small space in the image. Often other measurement parameters can be modified for the individual spot meters as well. A spot meter can be placed on a particular object in the image and the emissivity or background value changed for just that particular marker tool. It should be noted that the measurement area is NOT a single pixel. The exact number of pixels averaged can vary from manufacturer to manufacturer—as well as model to model—and it is not a published specification. For example, it may be a 3x3 or 5x5 area (9 and 25 pixels respectively) that is measures. Generally speaking, the spot meter is probably the most widely used measurement tool.
Area Box/Area Marker: The area marker typically allows selection of what temperature value is displayed. Depending upon your application and what information you’re hoping to convey, you could select maximum temperature, minimum temperature or average temperature within the area marker to be displayed. The advantage of an area marker over a spot meter is that you can select an area and get a maximum or minimum value without having to move the spot meter around to search for the hottest temperature. The shape of the area marker can often be modified from rectangular, oval/circular or even a polygon shape that can be drawn around a particular area in the image. Like the spot meter, it is NOT a single pixel measurement.
Hot/Cold Markers: These tools will automatically place a marker in the hottest and coldest spots in your thermal image. These can be particularly useful when comparing several surfaces to one another. If they are selectable in your imager, these markers will jump around on your view screen on a live image, which can be distracting for some thermographers. Hot and cold markers may sometimes be enabled in the camera software on a saved image.
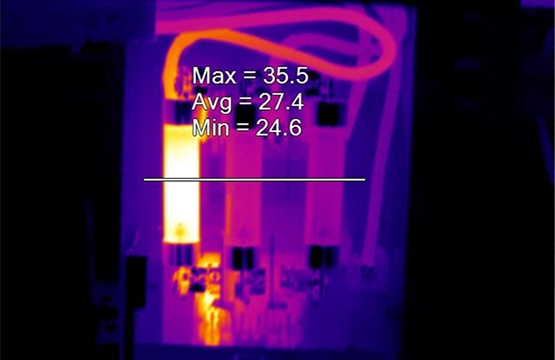
 Line Tool: Most camera software packages provide a line tool which allows the thermographer to draw a line across equipment or surfaces in the image and the software will either graph the temperatures along the line in bar graph, or give the Max/Min/Avg apparent temperatures on the line drawn.. These can be useful for reports or for illustrating problems such as varying temperatures across a matched belt set or across a 3-phase fused device, as in the following example.
In our final installment, we’re going to discuss a few other measurement tools as well as how to decide which to choose for your reporting purposes.